Chapter 4 Diving into the anthill
Mathematical regularities arise in the human world as soon as one shifts the attention from the individual to the collective [258]. In human societies there are transitions from disorder to order, like the spontaneous formation of a common language or the emergence of consensus about a specific issue. There are further examples of scaling, self-organization and universality. These macroscopic phenomena naturally call for a statistical approach to social behavior in which the basic constituents of the system are not particules but humans [259]. In fact, in 1842, Auguste Comte, credited as the father of sociology, already divised this possibility: “Now that the human mind has grasped celestial and terrestial physics, mechanical and chemical, organic physics, both vegetable and animal, there remains one science, to fill up the series of sciences of observation - social physics. This is what men have now most need of […]” [18].
Despite the early observations in the XIX century about the possible existence of social physics, this area of research is still in its infancy. To understand why this is so, it might be enlightening to look at how research progressed in other areas of physics. For instance, in the XVI century Tycho Brahe recorded the position of celestial objects with unprecedented accuracy and quantity. After his death, his assistant Johannes Kepler analyzed his data and extracted the three basic laws describing planetary movement that bear his name. These, in turn, inspired Newton in the formulation, by the end of the XVII century, of the laws of motion and universal gravitation. It could be argued, then, that despite the great advances in sociology of the last century, we have just arrived to the first step of the process. That is, we are finally gathering data with unprecedented accuracy and quantity. To demonstrate it, and fully comprehend the paradigm shift that this represents, we can take the example of rumors.
During the second World War, the attention of social scientists was forcibly drawn to the subject of rumors. Not only it became aparent that wartime rumors impaired public morale and confidence, but it could also be used as a weapon of enemy propaganda. Initially, research was focused on understanding the psychology of rumors, interpreting them as something belonging to the individual. For instance, in 1944 Knapp defined a rumor as “a proposition for belief of topical reference disseminated without official verification”. He even proposed that to control rumors the people had to be well informed, have confidence in their leaders and even that authorities should prevent idleness, monotony and personal disorganization as rumors - he said - do not thrive among purposeful, industrious and busy people [260]. Soon after, in 1948, Allport and Postman slightly modified Knapp’s definition and said that a rumor was “a proposition for belief, passed along from person to person, usually by word of mouth, without secure standards of evidence being present”15
To study this spreading process, they performed several experiments. However, they were already aware of the limitations that in-lab experiments had in the particular context of rumors. For instance, they had to oversimplify rumors in order to track them. Further, the intrinsic motivation of spreading a rumor is lost if you are inside a lab and a scientist is telling you to do it, being the willingness to spread substituted by the willingness to cooperate with the experimenter. They also noted that outside the laboratory the narrator tends to add color to her story, but inside the laboratory the teller feels that her reputation is at stake and does her best to transmit it in the most precise way. Moreover, they usually worked with groups of six or seven individuals.
In contrast, in 2018 Vosoughi et al. were able to investigate the diffusion of more than 126,000 true and false news stories within a population of 3 million people using Twitter data [262]. They found that false news spread farther, faster, deeper and more broadly than the truth, something that clearly could not have been studied 50 years before. Furthermore, they also investigated the role that bots in charge of systematically spreading false news could play in the spreading, but found that even though they accelerated a bit the spreading, they did not affect their total reach. Yet, few months latter, Shao et al. analyzed a much broader set of news, with almost 400,000 thousand articles and found evidence that bots do play a key role in spreading low-credibility content [263]. This contradiction is a sign that new data sources not only provide information that was not accessible before, with unprecedented accuracy and quantity, but that they also represent a subject worth of study on their own.
In this context, in section 4.1 we will study the dynamics of a Spanish online discussion board, Forocoches, with the objective of disentangling how its microscopic properties lead to our macroscopic observations. This will be based on the work
O’Brien, J., Aleta, A., Gleeson, J. and Moreno, Y., Quantifying uncertainty in a predictive model for popularity dynamics, Phys. Rev. E 101:062311, 2020
As McFarland et al. noted, not only these new platforms might be interesting on their own, but also give raise to new social phenomena that could not take place without digital intermediation. For example, some years ago people were simply technically unable to share photos on the scale and frequency they do today. These technologically enabled social transactions are a specific category of behaviors, some which may affect, in turn, offline social dynamics and structures. Hence, data generated on digitally-mediated platforms represent new categories of social action, not different from other phenomena of sociological interest [65].
Along these lines, we will conclude this section analyzing crowd dynamics in a digital setting. In particular, we will analyze the dynamics that emerged in an event that took place on February 2014, in which nearly a million players joined together and played a crowd controlled game, i.e., a game in which the character of the videogame was controlled simultaneously by all players. Clearly, this type of event was completely unattainable, at least with such magnitude, without the Internet. Yet, we will see that patterns that are common in the offline world had their reflection on this event. This section will be based on the work
Aleta, A., and Moreno, Y., The dynamics of collective social behavior in a crowd controlled game, EPJ Data Sci., 8:1-16, 2019
Besides, as we shall see, not only the two systems that we will explore are interesting on their own, but they will also allow us to discuss the dynamics that emerges when humans come together in groups. Since the late XIX century the concept of group has received a lot of attention from psychologists and sociologists as it was observed that a group is not just the addition of the individuals that compose it. The appearance of the Internet, rather than breaking the boundaries that lead naturally to groups, has allowed the formation of new and larger groups - as some sort of virtual ant colonies.
4.1 Online discussion boards
A discussion board, or Internet forum, is an online discussion site where people can hold conversations in the form of posted messages [264]. These platforms are hierarchically organized in a tree-like structure. Each forum can contain a set of sub-forums dedicated to specific topics. Then, inside each sub-forum users can begin a new conversation by opening a thread. In turn, other users can participate in the conversation by sending posts to the thread.
In the last decade, social networks have revolutionized the way we interact with each other. Yet, Internet forums precede modern online social networks by several decades. The precursors of forums date from the late 1970s, although the first proper Internet forum as we know them today was the World-Wide Web Interactive Talk created in 1994 [265]. As Rheingold noted in 1993, in these platforms virtual communities were created, exceeding the limits of the offline world [266]. He stated that the main characteristics of these communities were the fact that they belonged to the cyberspace, that they were based on public discussion and that personal relationships could be developed among the participants. Of these aspects, probably the most characteristic one is the fact that there are no physical boundaries in these communities, allowing people from all over the world to come together. This already raised the interest of several researchers during the late 1990s and early 2000s [267], although we find particularly interesting the thoughts of the jurist Cass R. Sunstein [268]. In 1999, he published a work on group polarization and stated that:
“Many people have expressed concern about processes of social influence on the Internet. The general problem is said to be one of fragmentation, with certain people hearing more and louder versions of their own preexisting commitments, thus reducing the benefits that come from exposure to competing views and unnoticed problems. But an understanding of group polarization heightens these concerns and raises new ones. A `plausible hypothesis is that the Internet-like setting is most likely to create a strong tendency toward group polarization when the members of the group feel some sense of group identity’. If certain people are deliberating with many like-minded others, views will not be reinforced but instead shifted to more extreme points. This cannot be said to be bad by itself - perhaps the increased extremism is good - but it is certainly troublesome if diverse social groups are led, through predictable mechanisms, toward increasingly opposing and ever more extreme views. It is likely that processes of this general sort have threatened both peace and stability in some nations; while dire consequences are unlikely in the United States, both fragmentation and violence are predictable results. As we have seen, group polarization is intensified if people are speaking anonymously and if attention is drawn, though one or another means, to group membership. Many Internet discussion groups have precisely this feature. It is therefore plausible to speculate that the Internet may be serving, for many, as a breeding group for extremism.”
These words predicted, for instance, the problem of echo chambers - people only viewing information in social networks coming from those who think like them [269] -, the role of the Internet in the arab spring [270] or the appearance of extremist groups - such as incels [271] - roughly 20 years ahead and when the Internet was, in comparison with today, still in its infancy. Admittedly, his views were probably based on the large amount of research performed on group polarization that was carried out during the XX century. Psychologists, sociologists, economists, politicians… the fact that groups are not just the addition of individuals had already attracted the interest of scientists coming from very diverse fields.
The previous examples show that these discussion platforms are worth being studied on their own. But bear in mind that these systems also provide tons of valuable data about how people interact that can, in turn, be used to test hypothesis about social behavior that were put forward in other contexts. For instance, in 2005 Berger and Heath proposed the concept of idea habitats [272]. They argued that ideas have a set of environmental cues that prime people to think about them and to believe it may be relevant to pass along. Although their definition of habitat is quite broad (for instance, the current season is one of the cues building the habitat), we can clearly see that human groups in general, and online groups in particular, can be examples of habitats. Moreover, they said that to really test their ideas they would need a “perfect but unobtainable database” such as a “searchable database of all conversations”. Even though discussion platforms do not posses all the information, as discussions might be influenced by external factors, it might be possible to find examples of conversations that only make sense within a particular online system. In such a case, the system would surely represent a database of all conversations. In fact, in section 4.1.1 we will see one example along these lines.
This data can also help us understand how culture disseminates and evolves. In 1985, Sperber proposed that culture could be studied under the lenses of epidemiology - as something that propagates. Yet, he doubted that mathematical models were ever going to be needed to model cultural transmission [273]. Few years later, in 1997, Axelrod presented his seminal work on cultural dissemination. With a very simple mathematical model, he demonstrated that social influence, contrary to the expectations, could naturally lead to cultural polarization rather than homogenization [274]. The accelerated rate at which online platforms evolve, in comparison to their offline counterparts, can be used to test these assumptions in the light of data. Furthermore, the boundary between the online and offline culture is getting thinner now that all cultural expressions and personal experiences are shared across the internet. Thus, this data can be used to study the evolution of the new culture that is being formed, the culture of real virtuality in Castells terms [71].
To conclude this introduction, we can give yet another example of the opportunities that having such large amounts of data represent. In 2010 Onnela and Reed-Tsochas studied the popularity of all Facebook applications that were available when the data was collected [275]. This, they claimed, removed the sampling bias that was usually present in the studies of social influence, in which only successful products were actually taken into account. By doing so, they discovered that the popularity of those applications was governed by two very different regimes: an individual one in which social influence plays no role and a collective one in which installations were clearly influenced by the behavior of others. They proposed that this type of studies could be extrapolated to other online systems. For instance, they gave the example of the (back then) online book retailer Amazon and the online DVD rental service Netflix, which allowed their users to rate their products. This would lead to an endogenously generated social influence, at a rate unprecedented in the offline world, with important economic consequences. Actually, the fact that consumers were influenced by opinions found in the Internet was something that already attracted the attention of researchers in the early 2000s in, precisely, the context of Internet forums [276].
It should be clear the wide range of possibilities that analyzing discussion boards provide. Yet, the following sections will have much more modest goals. Our objective is to understand the dynamics of the board which, in turn, should help us to study much more complex phenomena such as social influence in the future.
4.1.1 Description of Forocoches
+++ Divide By Cucumber Error. Please Reinstall Universe And Reboot +++
“Hogfather”, Terry Pratchett
Forocoches is a Spanish discussion board created in 2003 to talk about cars16. Back in those days it was common to have forums of very diverse topics, unlike modern social networks in which all the information is gathered in the same place. This fact can easily be constated by looking at the name of the subsections that compose the board, figure 4.1. However, the discussions in the forum evolved throughout the years with more and more people gathering in the General subsection. Nowadays, this subsection contains over 80% of all the posts in the board and the discussions cover many topics that have nothing to do with cars, as it can be seen in figure 4.2.
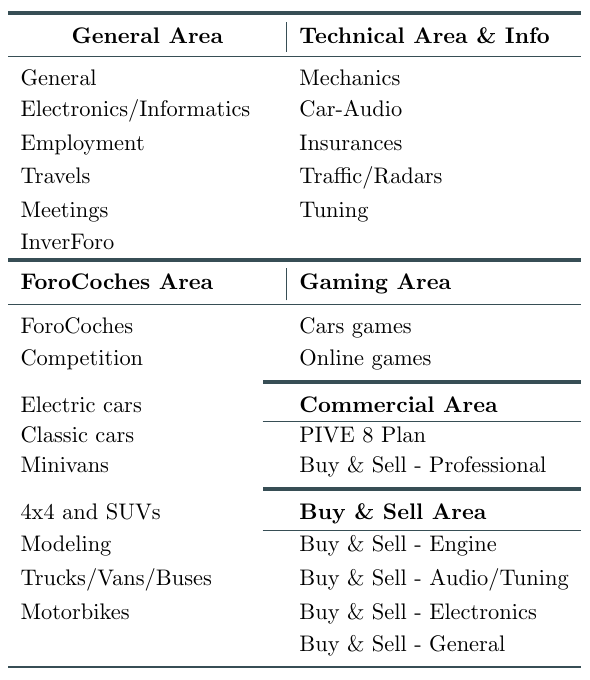
Figure 4.1: Subsections of the board (translated from Spanish). Most of the terms are related to cars, but the distribution of posts across the board is very heterogeneous with 80% of all the messages posted in the General subsection.
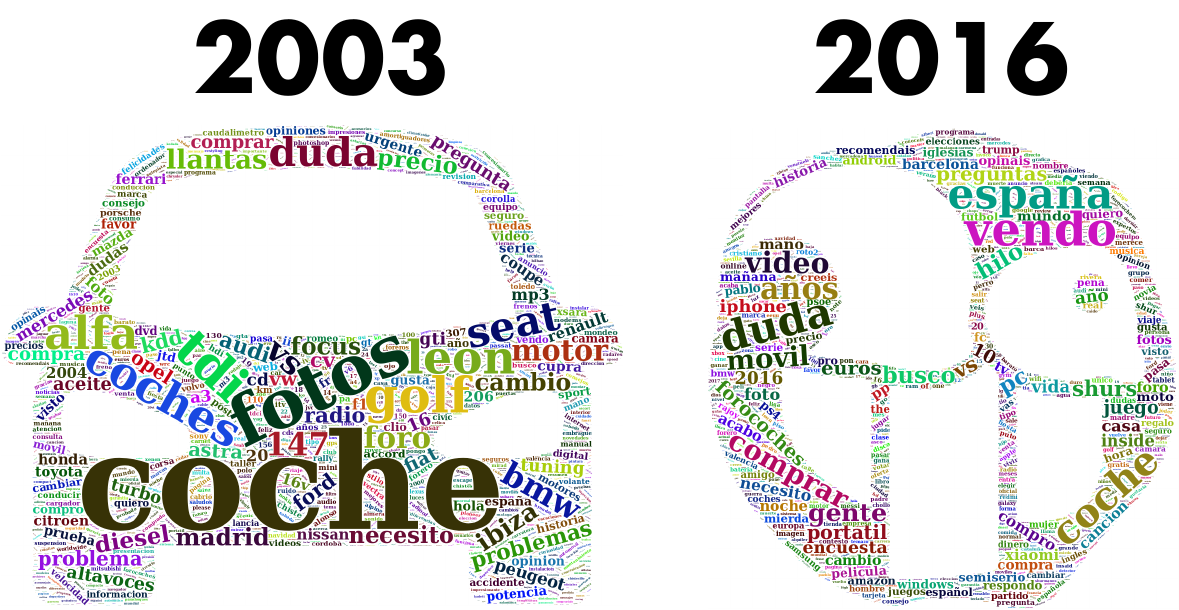
Figure 4.2: Topic evolution in Forocoches. Worclouds of the words used as thread titles. In 2003 the most common words were related to cars. Some of them refer to particular car models: alfa (alfa romeo), golf (Volkswagen golf), leon (seat leon), etc. Others represent car parts, technologies or accessories: tdi (turbocharged direct injection), cv (horsepower), llantas (rims), aceite (oil), cd, dvd, mp3… On the other hand, in 2016 the most common words refer to a broader set of topics. There are terms related to politics (pp, psoe, podemos and ciudadanos which were the main political parties in Spain in that year), technology (amazon, xiaomi, pc, iphone…), games (ps4, juego, pokemon…) to name a few.
A remarkable aspect of the forum is that since 2009 people can not register freely as in most social networks. Instead, to be able to create an account an invitation from a previous member is needed, and they were quite limited for a few years. Currently, there are some commercial campaigns that grant invitations making it slightly easier to obtain one, but in any case it is a much more closed community than common social networks in which anyone can create a new account. Note also that despite this fact the board has grown continuously since its creation, figure 4.3A.
Before going any further we should briefly describe the functioning of the board. As in other discussion boards, the information is organized in a tree-like structure. Each section is composed by a set of subsections. In each subsection, a new discussion can be started by opening a thread. Then, users can send posts to continue said discussion. From now own, we will restrict ourselves to the study of the General subsection, as it is the one with a broader set of topics and it is also the most active one as stated previously.
In the General subsection all threads that have received a new post within the last 24 hours are visible, although they are organized in a set of pages containing 40 threads each (very much like Google results). The threads appear in reverse chronological order, that is, the first thread is the one which received a new post most recently. Note that this is completely different from other social platforms in which the information is organized according to the liking of the user or related to her followers/friends. Thus, this should remove the problem of echo chambers that we mentioned previously, as people are shown all the information that is in the board regardless of whether it is suited to their likes or not. Although, admittedly, there could still be a bias due to the forum only containing a certain type of information, at least it is much easier to analyze, since it is not necessary to have precise data about the behavior of each single user.
Inside each thread, posts are organized in chronological order, being the first post the one that initiated the conversation and the last one the most recent one. Posts can contain text, images or videos. Besides, it is possible to cite a previous post in the thread (or in another thread). This does not modify the ordering of the posts, nor adds any points or likes to it. Indeed, unlike other platforms there are not any measures of popularity of posts, such as retweets or favorites. It should be noted that each thread can only contain up to 2,000 posts. Once the limit is reached the thread gets automatically closed and if users want to continue with the conversation they need to start a new thread. Nevertheless, the great majority of threads never reach that limit. This fact is shown in figure 4.3B, where the distribution of the threads sizes is plotted.
![Statistics of Forocoches. A) Number of new posts per month as a function of time. The activity in the forum has increased continuously since its creation in 2003. B) Distribution of thread popularity measured as number of posts per thread. The distribution can be fitted by a lognormal distribution (which is commonly found in online social media [279], [280]) with parameters \(\mu=2.79\) and \(\sigma=1.25\).](images/Fig_chap4_fc_evolution.png)
Figure 4.3: Statistics of Forocoches. A) Number of new posts per month as a function of time. The activity in the forum has increased continuously since its creation in 2003. B) Distribution of thread popularity measured as number of posts per thread. The distribution can be fitted by a lognormal distribution (which is commonly found in online social media [279], [280]) with parameters \(\mu=2.79\) and \(\sigma=1.25\).
Posts can only be sent by people that registered an account in the forum. An account has a nickname associated, as well as possibly a profile picture and some more information about the user. Unlike social networks, it is not possible to automatically track the activity of other users by following them or being friends (although it is always possible to go to their profile and check their latest posts). Thus, this system does not posses an explicit social network and thus the interactions between individuals should be based more on the topic than on social factors. Yet, we should emphasize that even if there is not an explicit underlying network like the ones we can find in social networks, it would be possible to construct networks that provide insights about the characteristics of the system. For instance, it would be possible to consider that users are nodes and that two users should be linked if they participate in the same thread. Further, these links could be weighted by the number of times this event occurs. Then, it would be possible to study how the information flows in the system or whether there are some underlying structures that might be hidden, such as groups of users that tend to always discuss about the same ideas together.
At this point, we should give some more details about the size of the board. Figure 4.3A shows that as of 2016 the forum received more than 1.5 million posts per month. According to the most recent statistics provided by the board, that number is now over 4 million. There are over 5 million threads, 340 million posts and 800 thousand users registered [281]. Although these numbers pale in comparison with the large social networks that are spread all over the world, note that in this case 90% of the traffic comes from Spain. This has some interesting consequences. On the one hand, it is much smaller than other social networks, making it easier to analyze but, at the same time, it is large enough to convey robust statistics. Moreover, the fact that the traffic comes mostly from Spain also facilitates the study of Spanish events without the sampling biases that arise when one uses the geo-location of users to determine where they come from in social media such as Twitter [282], [283].
Interestingly, it is possible to find remarkable similarities between Forocoches and other Internet platforms like Twitter. For instance, in figure 4.4, we show the daily activity patterns in both systems. In the case of Forocoches the data refers to the year 2015, while in Twitter it represents the tweets sent by people who had their geo-location activated and sent the tweets from within the United Kingdom during a week of October in 2015. As expected, both systems reflect the offline activity patterns of the population, with lower activities during the night. Yet, even though both systems exhibit a pattern that we could call double peaked, one at lunch time and another one at the beginning of the night, there are clear differences that might be related to the sociological characteristics of both countries. Again, this highlights that it is possible to extract much more information from these datasets that what it might seem at first glance.
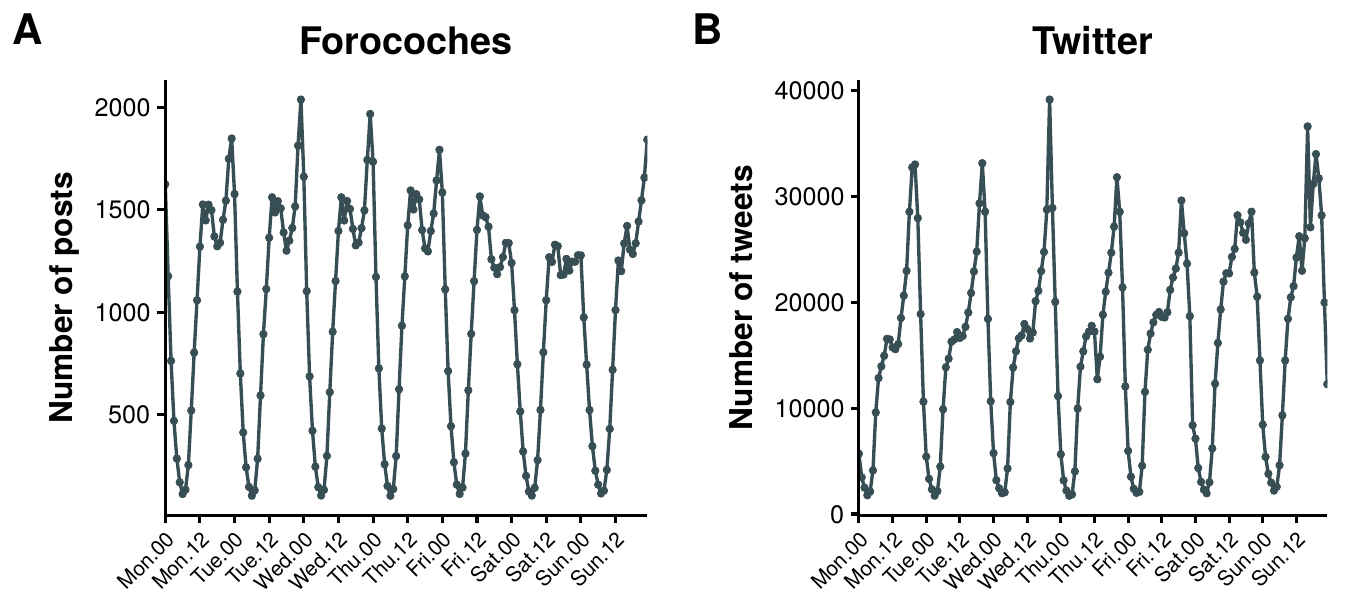
Figure 4.4: Daily activity of users in online social networks. A) Average number of posts sent as a function of time during 2015 in Forocoches. B) Average number of tweets sent as a function of time in October 2015 by users who had their geo-location activated and sent them from within the United Kingdom.
Another example of the possibilities that the study of these systems bring is shown in figure 4.5. The emergence of new social contexts has enabled slang to abound on the web [284]. Although it is not possible to track the whole evolution of terms that are used all over the Internet, it is possible to find words that only have meaning in a certain context. In this particular case, we show two examples of terms that have meaning only within the board. The interesting thing about them is not their meaning but the fact that it is possible to track their whole evolution, something that obviously cannot be done in the offline world [285]. This information can then be used to study the dynamics of the cultural evolution of language [286]. In other words, we have the database of all conversations that Berger and Heath needed to test their hypothesis of cultural habitats.
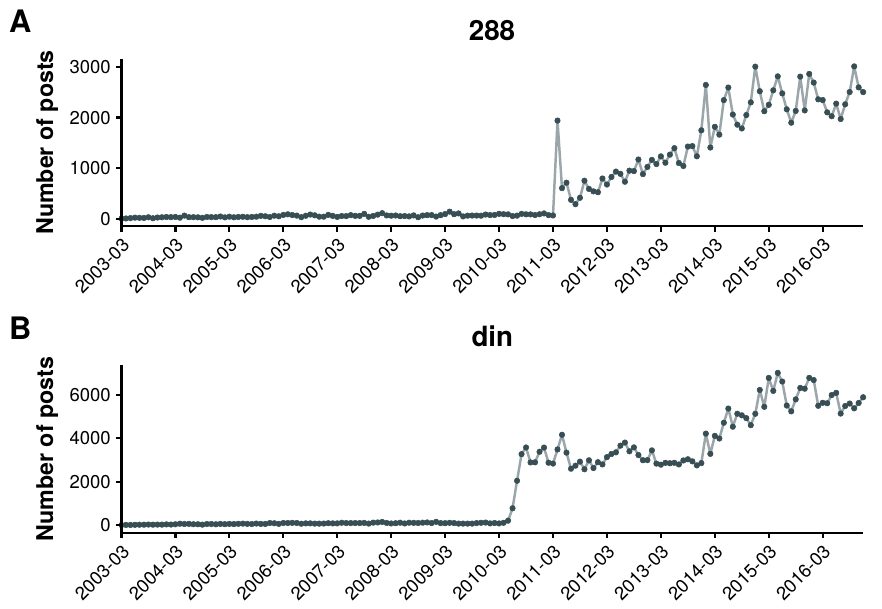
Figure 4.5: Evolution of slang in Forocoches. Usage of two memes in posts as a function of time. A) The term “288” originated when a user started a thread on the 8th of April of 2011 with the title “\(48 ÷ 2(9+3)=????\)”, prompting people to give their answer. A debate on whether the division or the multiplication had to be performed first arose, with 288 being the solution if the division is performed first. After that thread the term became a meme that is used as a joke to answer questions related to numbers. B) The term “din” originated in a thread started on the 30th of May of 2010. The first person to answer the thread (after the person that created it) wrote “DIN del POST” (din of the post) probably due to a mistake (the letter \(d\) is next to \(f\), which would be used to write fin, end). From that point on, the term gained popularity as a way of saying that someone posted an argument that answered the question being discussed.
Our goals are, however, much more modest for this part of the thesis. Our objective is to understand the mechanics behind the macroscopic behavior of the forum, which in turn should help us in the future to study more specific characteristics of the system such as the ones described so far. The starting point will be the following observation. Threads that have been inactive for over 24 hours are not removed like in other boards. Even though they are not present anymore in the list that can be directly accesed from the front page, they can still be accessed either by having their link or by finding them using Google or the own search engine of the forum. Nevertheless, it has been observed that, in Google, over 90% of the users do not go beyond the first page of results [287]. Hence, it seems reasonable to assume that users will tend to focus on the 40 threads that are on the front page. Thus, given that the more recently a thread has received a post, the most likely it is to be found in the first positions, we hypothesize that the dynamics of the forum should follow some sort of self-exciting process. In particular, we will focus on non-homogeneous Poisson processes, which have yielded satisfactory results when used to study other online social platforms, such as Twitter [288] and Reddit [289] (see [290] for a recent review on other applications of these processes).
4.1.2 Introduction to inhomogeneous Poisson processes
In general, point processes are used to describe the random distribution of points in a given mathematical space. In our case, this mathematical space will be the positive real line, so that events will be distributed across time. Moreover, we are not interested in the specific distribution of each event but rather on their cumulative count, as our objective is to elucidate the mechanisms leading to thread growth. In this case, point processes can be described as counting processes [291].
A counting process is a stochastic process defined by the number of events that have been observed (arrived) until time \(t\), \(N(t)\) with $t $. Thus, \(N(t) \in \mathbb{N}_0\), \(N(0)=0\) and it is a right-continuous step function with increments of size \(+1\). Further, we denote by \(\mathcal{H}_u\) with \(u\geq 0\) the history of the arrivals up to time \(u\). It is completely equivalent to refer to this process as a point process defined by a sequence of ordered random variables \(T=\{t_1,t_2,\ldots\}\).
These processes are characterized by the conditional intensity function, which reflects the expected rate of arrivals conditioned on \(\mathcal{H}_t\):
\[\begin{equation} \lambda(t|\mathcal{H}_t) = \lim_{h\rightarrow 0} \frac{P\{N(t,t+h]>0|\mathcal{H}_t\}}{h}\,. \tag{4.1} \end{equation}\]
The most common example of these processes is the homogeneous Poisson process, in which the conditional intensity is constant. Using equation (4.1) this can be properly defined as
\[\begin{equation} \begin{split} P\{N(t,t+h&] = 1 | \mathcal{H}_t\} = \lambda h + o(h) \\ P\{N(t,t+h&] > 1 | \mathcal{H}_t\} = o(h) \\ P\{N(t,t+h&] = 0 | \mathcal{H}_t\} = 1 - \lambda h + o(h) \\ &\Rightarrow \lambda(t|\mathcal{H}_t) = \lambda \,, \end{split} \tag{4.2} \end{equation}\]
with \(\lambda>0\). An interesting consequence of this definition is that the distance between two consecutive points in time is an exponential random variable with parameter \(\lambda\). This, in turn, implies that the distribution is memoryless, i.e., the waiting time (or interarrival time) until the next event does not depend on how much time has elapsed.
Conversely, a Poisson process is said to be inhomogeneous when the conditional intensity depends on time:
\[\begin{equation} \begin{split} P\{N(t,t+h&] = 1 | \mathcal{H}_t\} = \lambda(t) h + o(h) \\ P\{N(t,t+h&] > 1 | \mathcal{H}_t\} = o(h) \\ P\{N(t,t+h&] = 0 | \mathcal{H}_t\} = 1 - \lambda(t) h + o(h) \\ &\Rightarrow \lambda(t|\mathcal{H}_t) = \lambda(t) \,. \end{split} \tag{4.3} \end{equation}\]
In this section, we are interested in a specific type of inhomogeneous Poisson processes known as self-exciting or Hawkes processes, as introduced by Alan G. Hawkes in 1971 [292]. In these processes the conditional intensity not only depends on time, but also on the whole history of the event. Hence, it is given by
\[\begin{equation} \lambda(t) = \lambda_0(t) + \int_0^t \phi(t-s) \text{d}N_s\,. \tag{4.4} \end{equation}\]
The first term of this equation is the background intensity of the process while \(\phi(t-s)\) is the excitation function. This way, the conditional intensity depends on all previous events in a way that is determined by the excitation function. Henceforth, we may refer to the function \(\phi(t-s)\) as the kernel of the process.
Although the function \(\phi(t-s)\) can take almost any form, to gain some intuition about these processes a convenient choice is the exponential function. In fact, that was the function that Hawkes used to illustrate his paper. Hence, if \(\phi(t-s) = \alpha \exp(-\beta(t-s))\), we can rewrite equation (4.4) as
\[\begin{equation} \lambda(t) = \lambda_0(t) + \int_0^\infty \alpha e^{-\beta (t-s)} \text{d}N_s = \lambda_0(t) + \sum_{t_i<t} \alpha e^{-\beta(t-t_i)}\,, \tag{4.5} \end{equation}\]
where the constant \(\alpha\) can be interpreted as the instantaneous excitation of the system when a new event arrives and \(\beta\) as the rate at which said arrival’s influence decays.
In figure 4.6 we show an example of the intensity obtained using an exponential kernel. As it can be seen, every time a new event arrives, the intensity is incremented by a factor \(\alpha\) leading to new, clustered, arrivals. Then the intensity decays at rate \(\beta\) until it reaches the value of the background intensity. It is worth remarking that events in Hawkes processes tend to be clustered, i.e., the interarrival time is not independent as in homogeneous processes.
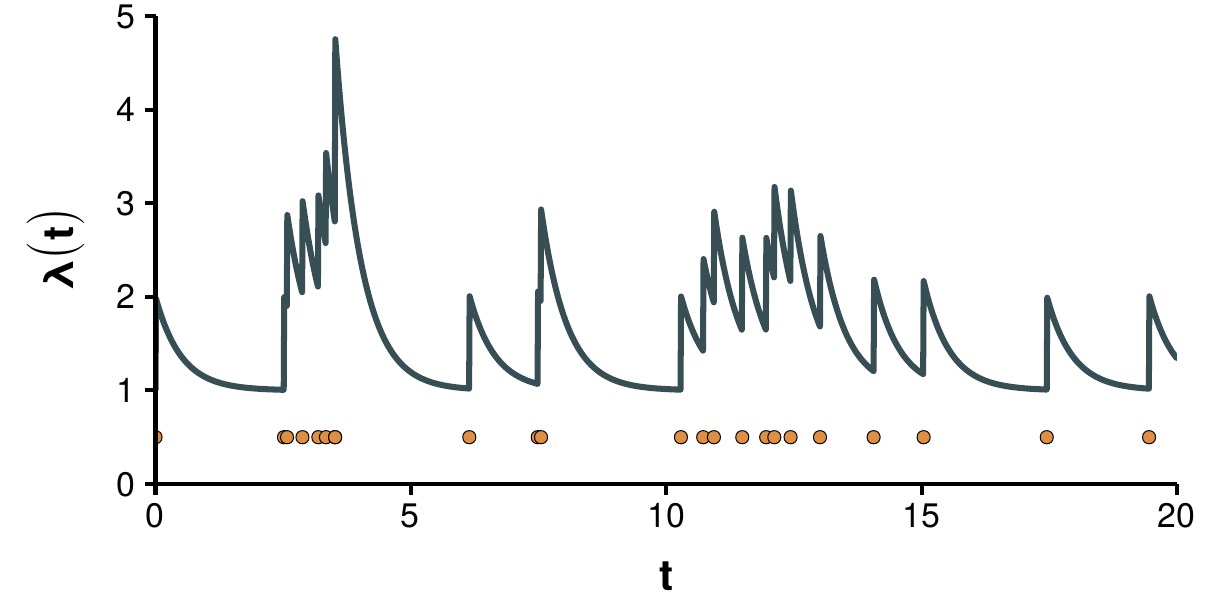
Figure 4.6: Conditional intensity function of a self-exciting process. Simulation of a Hawkes process with exponential kernel, \(\lambda_0 = 1\), \(\alpha = 1\) and \(\beta = 2\). The curve shows the value of the conditional intensity, while dots mark the moments at which a new event arrived.
This figure can also be used to introduce a different interpretation of the process. Suppose that the stream of immigrants arriving to a country forms a homogeneous Poisson process with rate \(\lambda_0\). Then, each individual can produce zero or more children independently of one another but following a simple inhomogeneous Poisson process (without excitation). The global arrival of new people to the country would then follow a Hawkes process. In the terminology of the forum, we could say that new posts arrive to the thread at a rate \(\lambda_0(t)\), which might depend on time because the activity of the users changes during the day (as we saw in figure 4.4), and that each of those posts sprout themselves a sequence of new posts until the thread disappears from the front page (its intensity gets back to the background intensity).
In branching terminology, this immigration-birth representation describes the Galton-Watson process that we briefly discussed in the introduction, albeit with a modified time dimension [293]. In this context, it is possible to define the branching ratio of the process as
\[\begin{equation} n = \int_0^\infty \phi(t) \text{d}t = \int_0^\infty \alpha e^{-\beta s} \text{d}s = \frac{\alpha}{\beta}\,, \tag{4.6} \end{equation}\]
which is the average number of offspring generated by each point event [294]. Both the definition of this parameter and its shape should ring some bells. Indeed, this expression is equivalent to the definition of the basic reproduction number that we saw in section 3.2. In fact, the SIR model can be studied as a Hawkes process [295]. Actually, the study of point processes has partially its origin in the demographic problems studied by mathematicians during the beginning of XX century such as Lotka, who was also the one that introduced the concept of the basic reproductive number in demography as discussed in section 3.2 [291].
A particularly successful application of Hawkes processes was introduced by Ogata in 1988 in the context of earthquakes [296]. Specifically, he used Hawkes processes to describe the occurrence of major earthquakes and the aftershocks that follow them, although he chose a different kernel. He proposed that the intensity should decay following a power law so that
\[\begin{equation} \lambda(t) = \lambda_0(t) + \sum_{i<t_i} \frac{\alpha}{(t-t_i+c)^{1+\beta}}\,. \tag{4.7} \end{equation}\]
Interestingly, he named his model for seismology the Epidemic-Type Aftershock Sequence model (ETAS).
The contribution of Ogata was not simply the introduction of the model to seismology. What really made his work outstanding was that, in a time where most researchers on point processes were mainly focused on their theoretical properties, he established a road map for how to apply point process models to real data using a formal likelihood-based inference framework [297]. The next section will be devoted to this issue.
4.1.3 Fitting Hawkes processes
If our intuition is correct, the arrival of posts to threads in Forocoches should be well described by a self-exciting process. In order to test this hypothesis we need two ingredients. First, we have to estimate the parameters that would yield the observed time sequence of a given thread. Then, we need to measure the quality of the model.
To estimate the set of parameters describing a thread we will use maximum likelihood estimation [298]. Suppose that \(\{t_1,t_2,\ldots,t_n\}\) is a realization over time \([0,T]\) from a point process with conditional intensity function \(\lambda(t)\). The likelihood of the process as a function of the set of parameters \(\theta\) can be expressed as
\[\begin{equation} \mathcal{L}(\theta) = \left[ \prod_{i=1}^n \lambda(t_i|\theta)\right] \exp\left(-\int_0^T \lambda(u|\theta) \text{d}u\right)\,, \tag{4.8} \end{equation}\]
and the log-likelihood is thus given by
\[\begin{equation} l(\theta) = \ln \mathcal{L}(\theta) = \sum_{i=1}^n \ln[\lambda(t_i|\theta)] - \int_0^T \lambda(u|\theta) \text{d} u \,. \tag{4.9} \end{equation}\]
For simplicity, we will assume that the background intensity is either zero or constant, so that \(\lambda_0(t) \equiv \lambda_0\). Hence, in the particular case of an exponential kernel, equation (4.5), the log-likelihood reads
\[\begin{equation} l = -\lambda_0 t + \frac{\alpha}{\beta} \sum_{i=1}^n \left[e^{-\beta(t_n-t_i)}-1\right] + \sum_{i=1}^n \ln[\lambda_0 + \alpha A(i)]\,, \tag{4.10} \end{equation}\]
where \(A(i) = e^{-\beta(t_i-t_{i-1})}(1+A(i-1))\) with \(A(0)=0\). As there is no closed form solution, it is necessary to numerically obtain the maximum of this function. Fortunately, this recursive relation greatly reduces the computational complexity of the problem. For this reason exponential kernels or power law kernels with exponential cut-off are the preferred choice in the analysis of high frequency trading [299]. Nevertheless, to speed up the computation, it is convenient to also calculate the derivatives of the log-likelihood:
\[\begin{equation} \begin{split} &\frac{\partial l}{\partial \lambda_0} = -t_n + \sum_{i=1}^n \frac{1}{\lambda_0 + \alpha A(i)} \\ &\frac{\partial l}{\partial \alpha} = \sum_{i=1}^n \frac{A(i)}{\lambda_0+\alpha A(i)} + \frac{1}{\beta} \sum_{i=1}^n\left[ e^{-\beta(t_n-t_i)}-1\right] \\ &\frac{\partial l}{\partial \beta} = \sum_{i=1}^n \frac{\alpha A'(i)}{\lambda_0 + \alpha A(i)} - \frac{\alpha}{\beta^2} \sum_{i=1}^n\left[e^{-\beta(t_n-t_i)}-1\right] + \frac{\alpha}{\beta} \sum_{i=1}^n \left[-(t_n - t_i) e^{-\beta(t_n-t_i)}\right]\,, \end{split} \tag{4.11} \end{equation}\]
where \(A'(i) = e^{-\beta(t_i-t_{i-1})}\left[-(t_i-t_{i-1})(1+A(i-1))+A'(i-1)\right]\) and \(A'(0) = 0\).
Similarly, the log-likelihood for the power law kernel defined in equation (4.7) can be expressed as
\[\begin{equation} l = - \lambda_0 t - \frac{\alpha}{\beta} \sum_{i=1}^n\left(\frac{1}{c^\beta}-\frac{1}{(t_n-t_i+c)^\beta}\right) + \sum_{i=1}^n \ln \left[\lambda_0 + \sum_{j=1}^i \frac{\alpha}{(t_i-t_j+c)^{1+\beta}}\right]\,. \tag{4.12} \end{equation}\]
In this case the computation of the kernel for long time sequences is more costly. The gradient for this expression reads
\[\begin{equation} \begin{split} &\frac{\partial l}{\partial \lambda_0} = -t_n + \sum_{i=1}^n \frac{1}{\lambda_0 + \alpha A(i)}\\ &\frac{\partial l}{\partial \alpha} = \sum_{i=1}^n \frac{A(i)}{\lambda_0 + \alpha A(i)} - \frac{1}{\beta} \sum_{i=1}^n \left(\frac{1}{c^\beta} - \frac{1}{(t_n-t_i+c)^\beta}\right)\\ &\frac{\partial l}{\partial \beta} = \sum_{i=1}^n \frac{-\alpha LA(i)}{\lambda_0 + \alpha A(i)} + \frac{\alpha}{\beta^2} \sum_{i=1}^n \left(\frac{1}{c^\beta} - \frac{1}{(t_n-t_i+c)^\beta}\right) + \frac{\alpha}{\beta} \left(\frac{\ln(c)}{c^\beta} - \frac{\ln(t_n-t_i+c)}{(t_n-t_i+c)^\beta}\right) \\ &\frac{\partial l}{\partial c} = - \sum_{i=1}^n \frac{\alpha (1+ \beta) A'(i)}{\lambda_0 + \alpha A(i)} +\alpha \sum_{i=1}^n \left(\frac{1}{c^{\beta+1}} - \frac{1}{(t_n-t_i+c)^{\beta + 1}}\right) \end{split} \tag{4.13} \end{equation}\]
with \(A(i) = \sum_{j=1}^i (t_i-t_j+c)^{-1-\beta}\), \(LA(i) = \sum_{j=1}^i \ln(t_i-t_j+c) (t_i-t_j+c)^{-1-\beta}\) and \(A'(i) = \sum_{j=1}^i (t_i-t_j+c)^{-2-\beta}\).
With these expressions we can easily estimate the set of parameters that would fit each thread in our dataset. To asses the quality of the fit, a common approach is to use tools as the Akaike information criterion (AIC) [300]. However, as already noticed by Ogata, AIC and related methods can provide information about which is the best model of all the ones being considered, but it does not say anything about whether there is a better model outside that set. Fortunately, there is a better option.
Suppose that the point process data \(\{t_i\}\) are generated by the conditional intensity \(\lambda(t)\). We define the compensator of the counting process as
\[\begin{equation} \Lambda(t) = \int_0^t \lambda(s) \text{d}s\,, \tag{4.14} \end{equation}\]
which in the case of the exponential kernel is equal to
\[\begin{equation} \Lambda(t_k) = \lambda_0 t_k - \frac{\alpha}{\beta} \sum_{i=1}^{k-1} \left[e^{-\beta(t-t_i)}-1\right]\,, \tag{4.15} \end{equation}\]
and for the power law kernel is
\[\begin{equation} \Lambda(t_k) = \lambda_0t_k + \frac{\alpha}{\beta} \sum_{i=1}^{k-1} \left(\frac{1}{c^\beta} - \frac{1}{(t_k-t_i+c)^\beta}\right)\,. \tag{4.16} \end{equation}\]
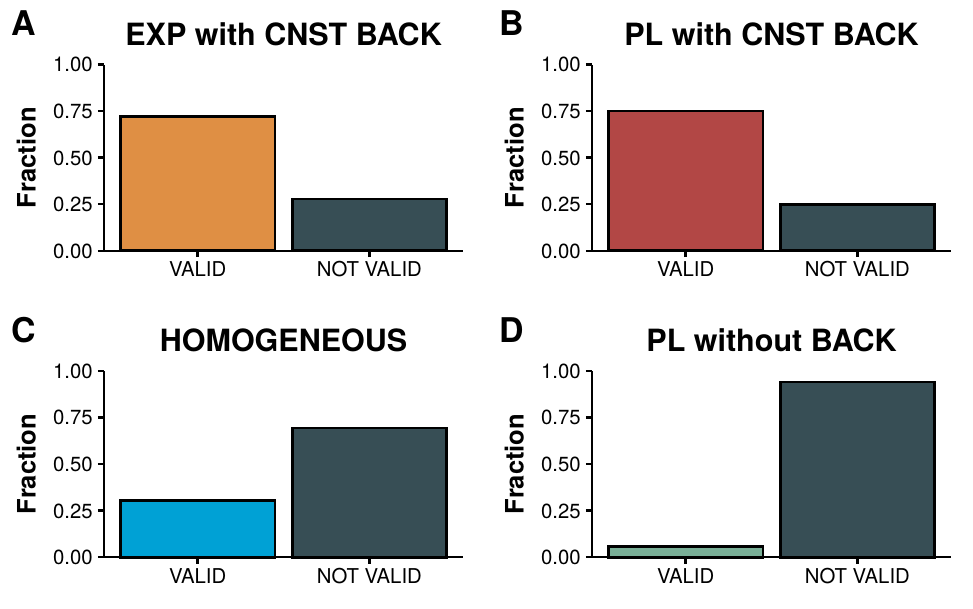
Figure 4.7: Fitting Hawkes processes to Forocoches threads. Each panels shows the fraction of threads that successfully pass all the tests described in section 4.1.3 with different kernel choices. A) Exponential kernel with constant background intensity. B) Power law kernel with constant background intensity. C) Homogeneous Poisson process. D) Power law kernel without background intensity.
With this definition we can now enunciate the random time change theorem [301]. If \(\{t_1,t_2,\ldots,t_k\}\) is a realization over time \([0,T]\) from a point process with conditional intensity function \(\lambda(t)\), then the transformed points \(\{t_1^\ast,t_2^\ast,\ldots,t_k^\ast\}\) given by \(t_i^\ast = \Lambda(t_i)\) form a Poisson process with unit rate.
Therefore, if the estimated conditional intensity \(\lambda(t|\theta)\) is a good approximation to the true \(\lambda(t)\), then the transformed points \({t_i^\ast}\) should behave according to a Poisson process with unit rate. To test if the series forms a Poisson process we will check two of their main properties:
Independence: the interarrival times of the transformed points, \(\tau^\ast_i = t^\ast_i - t_{i-1}^\ast\) should be independent. This can be tested using the Ljung-Box test. The null hypothesis of this test is that the data presents no auto-correlations (in other words, they are independent). If the \(p\)-value is higher than 0.05 then the hypothesis cannot be discarded and thus the data might be independent.
Unit rate: if the values of \(\{\tau_i^\ast\}\) are extracted from an exponential with unit rate then the quantity \(x_k = 1- e^{-\tau_k^\ast}\) is uniformly distributed in the interval \([0,1]\). We can test this hypothesis using the Kolmogorov-Smirnov (KS) and Anderson-Darling (AD) tests.
Only if the estimated \(\lambda(t|\theta)\) passes all these tests we will accept that it is correctly describing the evolution of a thread as a Hawkes process with the kernel under consideration. With these tools we are finally ready to asses if the dynamics of the board can be captured by these processes or not.
4.1.4 The dynamics of the board
We consider all threads that started between 01-01-2011 and 01-01-2012 with 10 or more posts, which represent nearly 230,000 different conversations. To each thread we fit: a homogeneous Poisson process; a Hawkes process with exponential kernel and constant background intensity; with power law kernel and constant background intensity; and with power law kernel without background intensity.
In figure 4.7 we show the fraction of threads that successfully pass all the tests for each kernel choice. For the moment we are not asking which model is better, only which one can fit the largest amount of threads. As we can see, both the exponential kernel and the power law kernel with constant background are able to model 75% of the threads. In contrast, an homogeneous Poisson model can only explain 25% of the threads and a power law kernel without background intensity only a tiny fraction of roughly 5%.
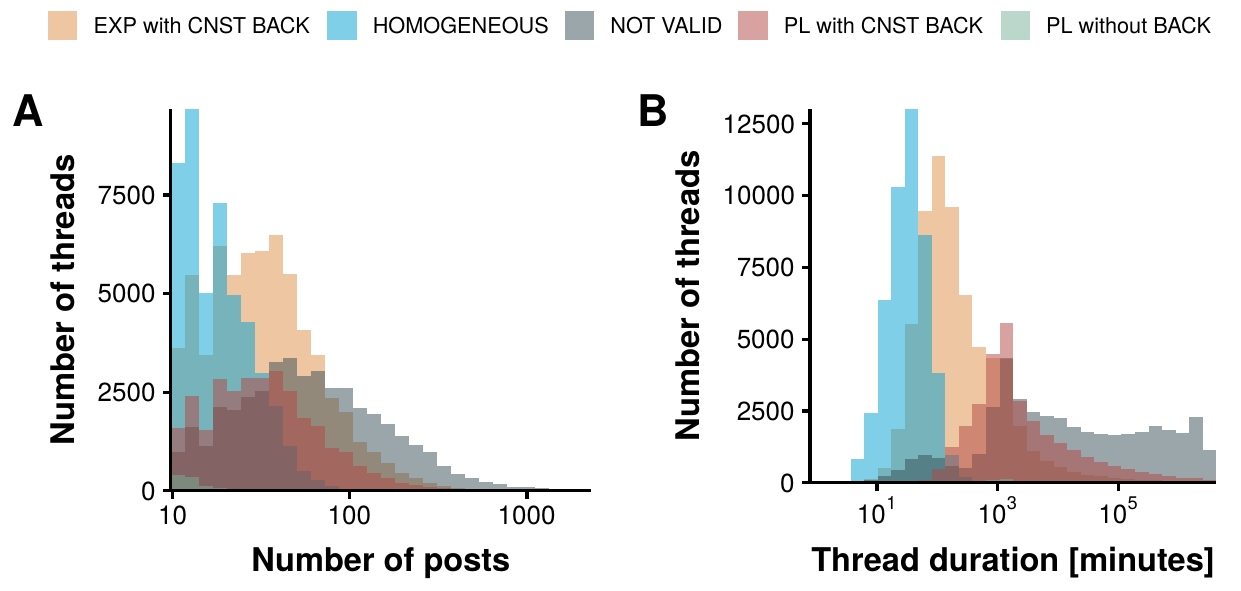
Figure 4.8: Best model as a function of external factors. For each thread that is successfully described by any of the processes that we are considering, we select the model that better fits the data using BIC. In panel A we show the distribution of those threads as a function of their popularity, i.e., their number of posts. In panel B we show the distribution as a function of the time length of the thread instead, i.e., the difference in minutes between the last and first posts.
These results partially confirm our hypothesis, as the dynamics of most threads can be well described with Hawkes processes. However, to fully understand the mechanisms underlying this system we need to address the question of what is the difference between those threads that are correctly described and those that are not. In order to do so, we first determine which is the best model for each thread. We choose to asses this using the Bayesian information criterion (BIC) as it penalizes more those models with several parameters than AIC. This is quite important given that each choice of the kernel yields a different amount of parameters.
In figure 4.8A we plot the distribution of thread size (total number of posts) distinguishing which model is better fitted to each thread. The results are quite interesting. First, the power law kernel without background intensity can only fit a tiny fraction of very short threads, signaling that the background activity of the forum is very important. Then, we find that the threads that can be fitted by a homogeneous model tend to be also rather small. In order to be able to explain larger threads, either the exponential or the power law kernels with background intensity are needed. Lastly, the longest threads cannot be described using these models.
These observations seem to point out in a similar direction as in the Facebook work that we discussed in 4.1. Indeed, in that setting, it was observed that there was a transition between a regime in which popularity was completely independent from the collective action of users and a regime in which social influence was important. In a similar fashion, we find that small threads can be studied as homogeneous Poisson processes, i.e., the arrival of new posts is independent of the ones that are already there. Conversely, once social influence comes into play, threads can reach a larger amount of popularity.
The only thing left is to disentangle why the most popular threads cannot be captured by these models. To do so, in figure 4.8B we show the distribution of thread duration, measured as the time elapsed between the very first post and the last one, as a function of which model better fits the thread. In this case we can see that those threads better fitted by a homogeneous Poisson model are those that last only for a few minutes. Once their length is over a few hours, the exponential kernel is needed. For even longer threads, a slower decay rate is needed, hence the power law fits better. Lastly, threads that are exceptionally long cannot be fitted by any of these models. This is, however, not surprising.
Recall that in figure 4.4 we saw that the daily patterns of activity highly depend on the time of the day. Hence, it is to be expected that when a thread last for over a few hours, the effects that this activity can have in the background intensity start to be noticeable. Yet, we have considered that the background intensity is constant, something that clearly goes against this observation. Hence, to be able to explain the behavior of longer threads, a background intensity that is somehow proportional to the activity of the forum would be needed.
In conclusion, we have seen that data from discussion boards conveys a large array of opportunities for research. We have focused on disentangling the underlying dynamics of the system, for which we have proposed that a self-exciting process would be adequate. The results presented in this section signal that this hypothesis is correct, showing that there are two regimes in the forum: one in which activity is essentially random and one in which social influence plays a key role. However, in order to be able to completely characterize all types of threads, more complex models, such as background intensities that depend on the hour of the day, would be needed.
4.2 The dynamics of a crowd controlled game
The intelligence of that creature known as a crowd is the square root of the number of people in it
“Jingo”, Terry Pratchett
Collective phenomena have been the subject of intense research in psychology and sociology since the XIX century. There are several ways in which humans gather to perform collective actions, although observations suggest that most of them require some sort of diminution of self-identity [302]. One of the first attempts to address this subject was Le Bon’s theory on the psychology of crowds in which he argued that when people are part of a crowd they lose their individual consciousness and become more primitive and emotional thanks to the anonymity provided by the group [303]. In the following decades, theories of crowd behavior such as the convergence theory, the emergent norm theory or the social identity theory emerged. These theories shifted away from Le Bon’s original ideas, introducing rationality, collective norms and social identities as building blocks of the crowd [304], [305].
The classical view of crowds as an irrational horde led researchers to focus on the study of crowds as something inherently violent, and thus, to seek for a better understanding and prediction of violence eruption, or at least, to develop some strategies to handle them [306]. However, the information era has created a new kind of crowd, as it is no longer necessary to be in the same place to communicate and take part of collective actions. Indeed, open source and “wiki” initiatives, as well as crowdsourcing and crowdworking, are some examples of how crowds can collaborate online in order to achieve a particular objective [307], [308]. Although this offers a plethora of opportunities, caution has to be taken because, as research on the psychology of crowds has shown, the group is not just the simple addition of individuals [309]. For example, it has been observed that the group performance can be less efficient than the sum of the individual performances if they had acted separately [310]. What are the conditions for this to happen and whether the group is more than the individuals composing it are two current challenges of utmost importance if, for instance, one wants to use online crowds as a working force.
To be able to unlock the potential of collective intelligence, a deeper understanding of the functioning of these systems is needed [311]. Examples of scenarios that can benefit from further insights into crowd behavior include new ways to reach group decisions, such as voting, consensus making or opinion averaging, as well as finding the best strategies to motivate the crowd to perform some task [312]. Regarding the latter, as arbitrary tasks usually are not intrinsically enjoyable, to be able to systematically execute crowdsourcing jobs, some sort of financial compensation is used [313]. This, however, implies dealing with new challenges, since many experiments have demonstrated that financial incentives might undermine the intrinsic motivation of workers or encourage them to only seek for the results that are being measured, either by focusing only on them or by free-riding [314]–[316]. A relevant case is given by platforms such as Amazon’s Mechanical Turk, that allow organizations to pay workers that perform micro-tasks for them, and that have already given rise to interesting questions about the future of crowd work [317]. In particular, its validity to be used for crowdsourcing behavioral research has been recently called into question [318].
Notwithstanding the previous observations, it is possible to find tasks that are intrinsically enjoyable by the crowd due to their motivational nature, which is ultimately independent of the reward [316]. This is one of the basis of online citizen science. In these projects, volunteers contribute to analyze and interpret large datasets which are later used to solve scientific problems [319]. To increase the motivation of the volunteers, some of these projects are shaped as computer games [320]. Examples range from the study of protein folding [321] to annotating people within social networks [322] or identifying the presence of cropland [323].
It is thus clear that to harness the full potential of crowds in the new era, we need a deeper understanding of the mechanisms that drive and govern the dynamics of these complex systems. To this aim, here we study an event that took place in February 2014 known as Twitch Plays Pokémon (TPP). During this event, players were allowed to control simultaneously the same character of a Pokémon game without any kind of central authority. This constituted an unprecedented event because in crowd games, each user usually has its own avatar and it is the common action of all of them what produces a given result [324]. Due to its novelty, in the following years it sprouted similar crowd controlled events such as The Button in 2015 [325] or Reddit r/place in 2017 [326], [327]. Similarly to those which came after it, TPP was a completely crowd controlled process in which thousands of users played simultaneously for 17 days, with more than a million different players [328]. TPP is specially interesting because it represents an out of the lab social experiment that became extremely successful based only on its intrinsic enjoyment and, given that it was run without any scientific purpose in mind, it represents a natural, unbiased (i.e., not artificially driven) opportunity to study the evolution and organization of crowds. Furthermore, the whole event was recorded in video, the messages sent in the chat window were collected and both are available online17 [329]. Hence, in contrast to the offline crowd events that were studied during the last century, in this case we possess a huge amount of information of both the outcome of the event but, even more important, the evolution of the crowd during the process.
4.2.1 Description of the event
On February 12, 2014, an anonymous developer started to broadcast a game of Pokémon Red on the streaming platform Twitch. Pokémon Red was the first installment of the Pokémon series, which is the most successful role playing game (RPG) franchise of all time [330]. The purpose of the game was to capture and train creatures known as Pokémons in order to win increasingly difficult battles based on classical turn-based combats. However, as Pokémon Go showed in the summer of 2016, the power of the Pokémon franchise goes beyond the classical RPG games and is still able to attract millions of players [331].
On the other hand, Twitch is an online service for watching and streaming digital video broadcast. Its content is mainly related to video games: from e-sports competitions to professional players games or simply popular individuals who tend to gather large audiences to watch them play, commonly known as streamers. Due to the live nature of the streaming and the presence of a chat window where viewers can interact among each other and with the streamer, in these type of platforms the relationship between the media creator and the consumer is much more direct than in traditional media [332]. Back in February 2014, Twitch was the 4th largest source of peak internet traffic in the US [333] and nowadays, with over 100 million unique users, it has become the home of the largest gaming community in history [334].
The element that distinguished this stream from the rest was that the streamer did not play the game. Instead, he set up a bot in the chat window that accepted some predefined commands and forwarded them to the input system of the video game. Thus, anyone could join the stream and control the character by just writing one of those actions in the chat. Although all actions were sent to the video game sequentially, it could only perform one at a time. As a consequence, all commands that arrived while the character was performing a given action (which takes less than a second) did not have any effect. Thus, it was a completely crowd controlled game without any central authority or coordination system in place. This was not a multiplayer game, this was something different, something new [335].
Due to its novelty, during the first day the game was mainly unknown with only a few tens of viewers/players and as a consequence little is known about the game events of that day [336]. However, on the second day it started to gain viewers and quickly went viral, see figure 4.9. Indeed, it ramped up from 25,000 new players on day 1 (note that the time was recorded starting from day 0 and thus day 1 in game time actually refers to the second day on real time) to almost 75,000 on day 2 and an already stable base of nearly 10,000 continuous players. Even though there was a clear decay on the number of new users after day 5, the event was able to retain a large user base for over two weeks. This huge number of users imposed a challenge on the technical capabilities of the system, which translated in a delay of between 20 and 30 seconds between the stream and the chat window. That is, users had to send their commands based on where the player was up to 30 seconds ago.
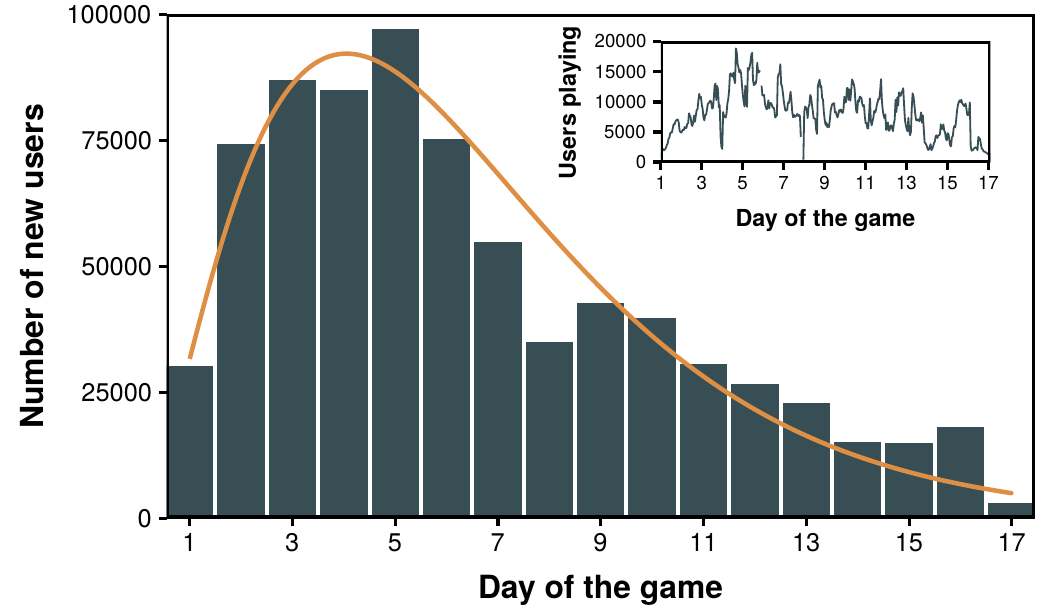
Figure 4.9: Popularity of the stream. Number of new users that arrived each day. The histogram is fitted to a gamma distribution with parameters \(\alpha=2.66\) and \(\beta=0.41\). Note that this reflects those users who inputted at least one command, not the number of viewers. In the inset we show the total number of users who sent at least 1 message each hour, regardless on whether they were new players or not.
Although simple in comparison to modern video games, Pokémon Red is a complex game which can not be progressed effectively at random. In fact, a single player needs, on average, 26 hours to finish the game [337]. Nevertheless, only 7 commands are needed to complete the game. There are 4 movement commands (up, right, down and left), 2 actions commands (a and b, accept and back/cancel) and 1 system button (start which opens the game’s menu). As a consequence the gameplay is simple. The character is moved around the map using the four movement commands. If you encounter a wild Pokémon you will have to fight it with the possibility of capturing it. Then, you will have to face the Pokémons of trainers controlled by the machine in order to obtain the 8 medals needed to finish the game. The combats are all turn-based so that time is not an important factor. In each turn of a combat the player has to decide which action to take for which the movement buttons along with a and b are used. Once the 8 medals have been collected there is a final encounter after which the game is finished. This gameplay, however, was much more complex during TPP due to the huge number of players sending commands at the same time and the lag present in the system.
A remarkable aspect of the event is that actions that would usually go unnoticed, such as selecting an object or nicknaming a Pokémon, yielded unexpected outcomes due to the messy nature of the gameplay. The community embraced these outcomes and created a whole narrative around them in the form of jokes, fan art and even a religion-like movement based on the judeo-christian tradition [338] both in the chat window and in related media such as Reddit. Although these characteristics of the game are outside of the scope of this thesis, it is another example of the new possibilities that digital systems bring in relation to the study of naming conventions and narrative consensus [339]. As we saw in section 4.1.1, language can evolve in digital platforms, with users developing new words that do not have any meaning outside the habitat where they were created. Not only it is a sign of the sociological richness of these systems, but also they might provide clues about the origin and evolution of slang in the offline world.
Returning to the discussion about the gameplay, even if it was at a slower peace, progress was made. Probably the first thing that comes to ones mind when thinking on how progressing was possible is the famous experiment by Francis Galton in which he asked a crowd to guess the weight of an ox. He found that the average of all estimates of the crowd was just 0.8% higher than the real weight [340]. Indeed, if lots of users were playing, the extreme answers should cancel each other and the character would tend to move towards the most common command sent by the crowd. Note, however, that as they were not voting, actions deviating from the mean could also be performed by pure chance. In general, this did not have great effects but as we will see in section 4.2.2 there were certain parts of the game where this was extremely relevant.
It is worth stressing that, to form a classical wise crowd, some important elements are needed, such as independence [341]. That is, the answer of each individual should not be influenced by other people in the crowd. In our case, this was not true, as the character was continuously moving. Indeed, the big difference of this crowd event to others is that opinions had effect in real time, and hence, people could see the tendency of the crowd and change its behavior accordingly. Theoretical [342] and empirical studies [343] have shown that a minority of informed individuals can lead a na"ive group of animals or humans to a given target in the absence of direct communication. Even in the case of conflict in the group, the time taken to reach the target is not increased significantly [343] which would explain why it only took the crowd 10 times more to finish the game than the average person. Although this amount may seem high, as we shall see later, the crowd got stuck in some parts of the game for over a day, increasing the time to finish. However, if those parts were excluded, the game progress can be considered to be remarkably fast, despite the messy nature of the gameplay.
As a matter of fact, the movement of the character on the map can be probably better described as a swarm rather than as a crowd. Classical collective intelligence, such as the opinions of a crowd obtained via polls or surveys, has the particularity stated previously of independence but, in addition, asynchrony. It has been shown that when there is no independence, that is, when users can influence each other, as long as the process is asynchronous the groups decisions will be distorted by social biasing effects [344]. Conversely, when the process is synchronous, mimicking natural swarms, these problems can be corrected [345]. Indeed, by allowing users to participate in decision making processes in real time with feedback about what the rest is doing, in some sort of human swarm, it is possible to explore more efficiently the decision space and reach more accurate predictions than with simple majority voting [346]. Admittedly, the interaction in the online world is so different that maybe the term crowd cannot be straightforwardly applied to online gatherings. In fact, it has recently been suggested that online crowds might be better described as swarms as something in-between crowds and networks [347].
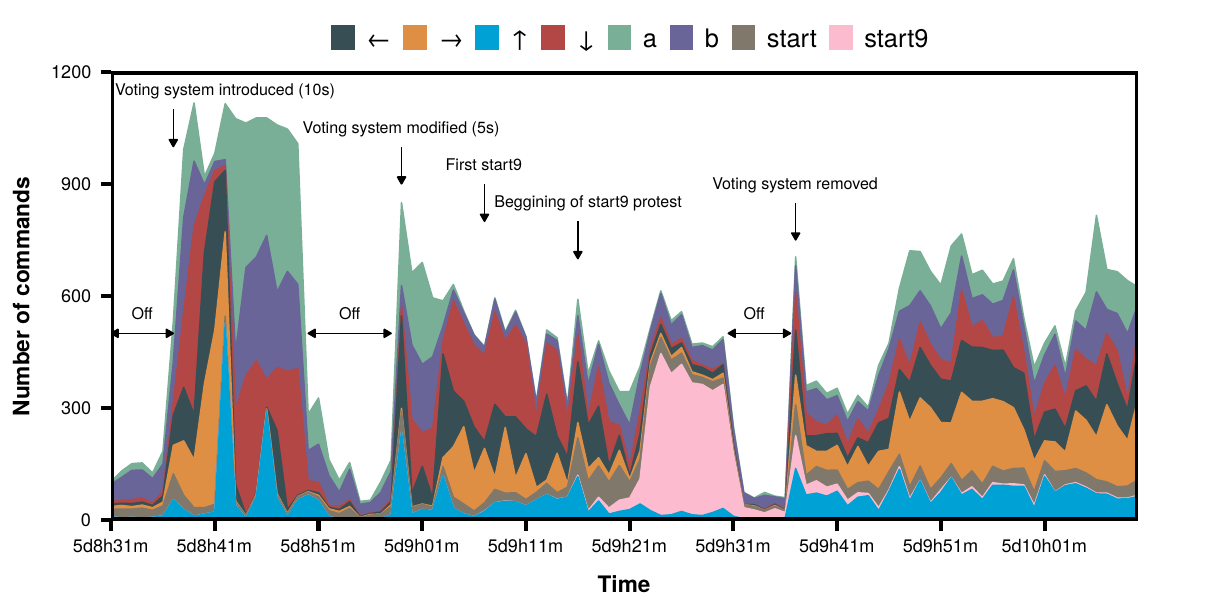
Figure 4.10: Introduction of the voting system. Command distribution after the first introduction of the voting system. Once the system was back online votes would tally up over a period of 10 seconds. After 15 minutes the system was brought down to reduce this time to 5 seconds. This, however, did not please the crowd and it started to protest. The first \(start9\) was sent at 5d9h8m but went almost unnoticed. Few minutes after, it was sent again but this time it got the attention of the crowd. In barely 3 minutes it went from 4 \(start9\) per minute to over 300, which stalled the game for over 8 minutes. The developer brought down the system again and removed the voting system, introducing the anarchy/democracy system a few hours later.
Even though the characteristics described so far already make this event very interesting from the research point of view, on the sixth day the rules were slightly changed, which made the dynamics even richer. After the swarm had been stuck in a movement based puzzle for almost 24 hours, the developer took down the stream to change the code. Fifteen minutes later the stream was back online but this time commands were not executed right away. Instead, they were added up and every 10 seconds the most voted command was executed. In addition, it was possible to use compound commands made of up to 9 simple commands such as \(a2\) or \(aleftright\) which would correspond to executing \(a\) twice or \(a\), \(left\) and \(right\) respectively. Thus, the swarm became a crowd with a majority rule to decide which action to take. As it waited 10 seconds between each command, progress was slow and, twenty minutes after, that time was reduced to 5 seconds. However, the crowd did not like this system and started to protest by sending \(start9\) which would open and close the menu repeatedly impeding any movement. This riot, as it was called, lasted for 8 minutes (figure 4.10), moment when the developer removed the voting system. However, two hours later the system was modified again. Two new commands were added: democracy and anarchy, which controlled some sort of tug of war voting system over which rules to use. If the fraction of people voting for democracy went over a given threshold, the game would start to tally up votes about which action to take next. If not, the game would be played using the old rules. This system split the community into “democrats” and “anarchists” who would fight for taking control of the game. Therefore, the system would change between a crowd-like movement and a swarm-like movement purely based on its own group interactions. We will analyze this situation in section 4.2.3.
4.2.2 The ledge
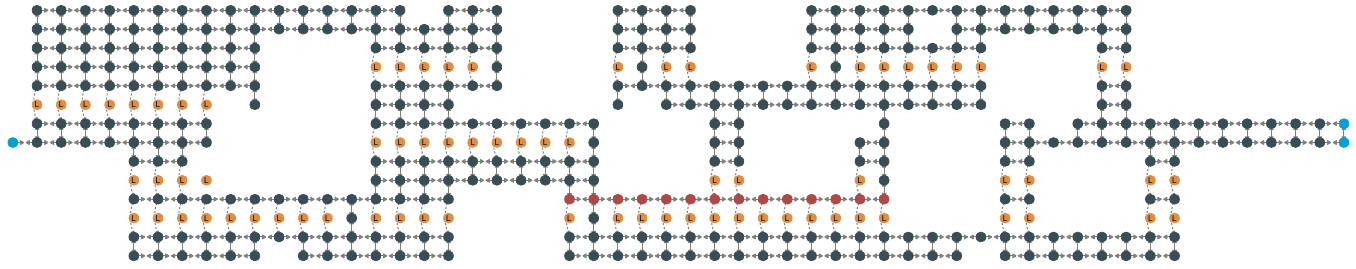
Figure 4.11: Network representation of the ledge area. It is possible to go from each node to the ones surrounding it using the commands \(up\), \(right\), \(down\) and \(left\). The only exception are the yellow nodes labeled \(L\) which correspond to ledges. If the character tries to step on one of those nodes it will be automatically sent to the node right below it, characteristic that is represented by the curved links connecting nodes above and below ledges. Light blue nodes mark the entrance and exit of the area and red nodes highlight the most difficult part of the path. Note that as the original map was composed by discrete squared tiles this network representation is not an approximation but the exact shape of the area.
On the third day of the game, the character arrived to the area depicted in figure 4.11 (note that the democracy/anarchy system we just described had not been introduced yet). Each node of the graph represents a tile of the game. The character starts on the light blue node on the left part of the network and has to exit through the right part, an event that we will define as getting to one of the light blue nodes on the right. The path is simple for an average player but it represented a challenge for the crowd due to the presence of the yellow \(L\)-nodes. These nodes represent ledges which can only be traversed going downwards, effectively working as a filter that allows flux only downwards. Thus, one good step will not cancel a bad step, as the character would be trapped down the ledge and will have to find a different path to go up again. For this reason, this particular region is highly vulnerable to actions deviating from the norm, either caused by mistake or performed intentionally by griefers, i.e., individuals whose only purpose is to annoy other players and who do so by using the mechanisms provided by the game itself [348], [349] (note that in social contexts these individuals are usually called trolls [350]). Indeed, there are paths (see red nodes in figure 4.11) where only the command right is needed and which are next to a ledge so that the command down, which is not needed at all, would force the crowd to go back and start the path again. Additionally, the existence of the lag described in section 4.2.1 made this task even more difficult.
In figure 4.12A we show the time evolution of the amount of messages containing each command (the values have been normalized to the total number of commands sent each minute) since the beginning of this part until they finally exited. First, we notice that it took the crowd over 15 hours to finish an area that can be completed by an optimal walk in less than 2 minutes. Then, we can clearly see a pattern from 2d18h30m to the first time they were able to reach the nodes located right after the red ones, approximately 3d01h10m: when the number of rights is high the number of lefts is low. This is a signature of the character trying to go through the red nodes by going right, falling down the ledge, and going left to start over. Once they finally reached the nodes after the red path (first arrival) they had to fight a trainer controlled by the game, combat which they lost and as a consequence the character was transported outside of the area and they had to enter and start again from the beginning. Again, we can see a similar left-right pattern until they got over that red path for the second time, which in this case was definitive.
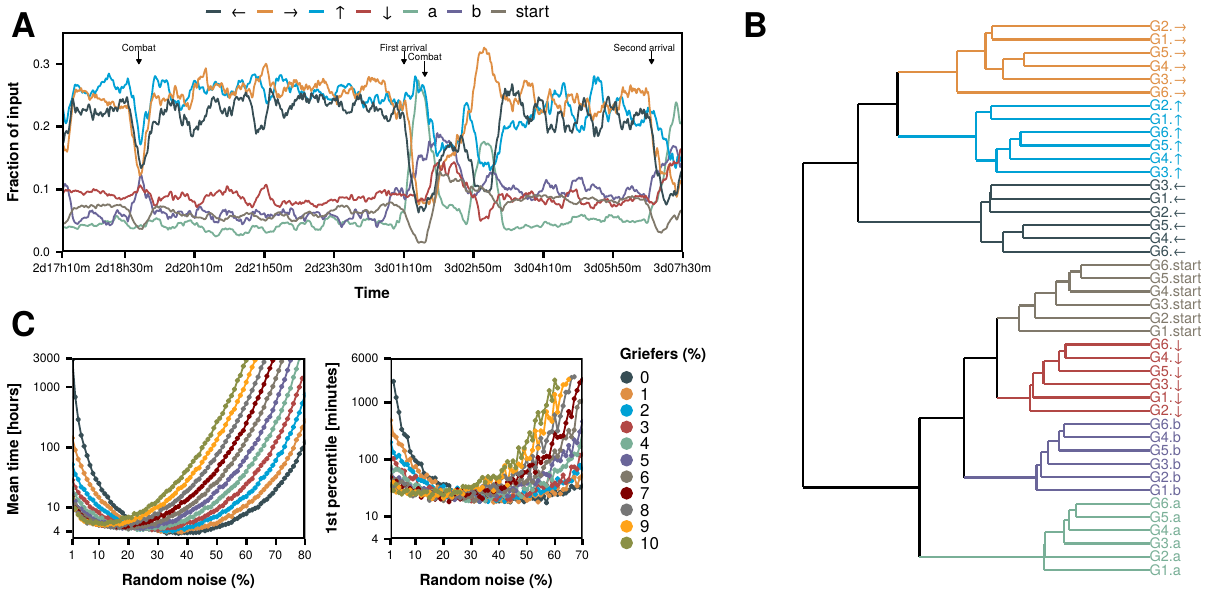
Figure 4.12: Study of the ledge event. A) Time evolution of the fraction of commands sent each minute. Note that a single player should be able to finish this area in a few minutes, but the crowd needed 15 hours. The time series has been smoothed using moving averages. B) Hierarchical clustering of the time series of each group of users. C) Left: Mean time needed to exit the area according to our model as a function of the fraction of griefers and noise in the system. Right: 1st percentile of the time needed to exit the area, note that the \(y\) axis is given in minutes instead of hours.
The ledge is a great case study of the behavior of the crowd because the mechanics needed to complete it is very simple (just moving from one point to another), which facilitates the analysis. But, at the same time, it took the players much longer to finish this area than what is expected for a single player. To address all these features, we propose a model aimed at mimicking the behavior of the crowd. Specifically, we consider a \(n\)-th order Markov Chain so that the probability of going from state \(x_{m}\) to \(x_{m+1}\) depends only on the state \(x_{m-n}\), thus accounting for the effect of the lag of the dynamics. Furthermore, the probabilities of going from one state to another will be set according to the behavior of the players in the crowd.
To define these probabilities, we first classify the players in groups according to the total number of commands they sent in this period: G1, users with 1 or 2 commands (46% of the users); G2, 3 or 4 commands (18%); G3, between 5 and 7 commands (13%); G4, between 8 and 14 commands (12%); G5, between 15 and 25 commands (6%); and G6, more than 25 commands (5%). These groups were defined so that the total number of messages sent by the first three is close to 50,000 and 100,000 for the other three (if we had selected the same value for all of them, either we would have lost resolution in the small ones or we would have obtained too many groups for the most active players). Interestingly, the time series of the inputs of each of these groups are very similar. Actually, if we remove the labels of the 42 time series and cluster them using the euclidean distance, we obtain 7 clusters, one for each command. Even more, the time series of each of the commands are clustered together, figure 4.12B. In other words, the behavior of users with medium and large activities are not only similar to each other, but they are also equivalent to the ones coming from the aggregation of the users who only sent 1 or 2 commands.
In this context we could argue that users with few messages tend to act intuitively as they soon lose interest. According to the social heuristics hypothesis [351], fast decisions tend to increase cooperation, which in this case would mean trying to get out of the area as fast as possible. Similarly, experiments have shown that people with prosocial predispositions tend to act that way when they have to make decisions quickly [352]. Thus, users that send few commands might tend to send the ones that get the character closer to the exit, which would explain why without being aware of it, they behave as those users that tried to progress for longer. However, coordination might not be so desirable in this occasion. The problem with players conforming with the majoritarian direction or mimicking each other is that they will be subject to herding effects [353], [354] which in this particular setting can be catastrophic due to the lag present in the system. Indeed, if we set the probabilities in our model so that the next state in the transition is always the one that gets you closer to the exit but with 25 seconds of delay (that is, the probability of going from state \(x_m\) to \(x_{m+1}\) is the probability of going from \(x_{m-n}\) to the state which follows the optimal path), the system gets stuck in a loop and is never able to reach the exit.
Nevertheless, the chat analysis shows that players were not perfectly coordinated. Thus, to make our model more realistic we consider that each time step there are 100 users with different behaviors introducing commands. In particular, we consider variable quantities of noisy users who play completely at random, griefers who only press down to annoy the rest of the crowd and the herd who always sends the optimal command to get to the exit. The results, figure 4.12C, show that the addition of noise to the herd breaks the loops and allows the swarm to get to the exit. In particular, for the case with no griefers we find that with 1 percent of users adding noise to the input the mean time needed to finish this part is almost 3,000 hours. However, as we increase the noise, time is quickly reduced with an optimal noise level of around 40% of the swarm. Conversely, the introduction of griefers in the model, as expected, increases the time needed to finish this part in most cases. Interestingly though, for low values of the noise, the addition of griefers can actually be beneficial for the swarm, allowing the completion of this area in times compatible to the observed ones. Indeed, by breaking the herding effect, griefers are unintentionally helping the swarm to reach their goal.
Whether the individuals categorized as noise were producing it unintentionally or doing it on purpose to disentangle the crowd (an unknown fraction of users were aware of the effects of the lag and they tried to disentangle the system [355]) is something we can not analyze because, unfortunately, the resolution of the chat log in this area is in minutes and not in seconds. We can, however, approximate the fraction of griefers in the system thanks to the special characteristics of this area. Indeed, as most of the time the command \(down\) is not needed \(-\)on the contrary, it would destroy all progress\(-\), we can categorize those players with an abnormal number of \(downs\) as griefers. To do so, we take the users that belong to \(G6\) (the most active ones) and compare the fraction of their inputs that corresponds to \(down\) between each other. We find that 7% have a behavior that could be categorized as outlier (the fraction of their input corresponding to \(down\) is higher than 1.5 times the inter quartile range). More restrictively, for 1% of the players, the command \(down\) represents more than half of their inputs. Both these values are compatible with the observed time according to our model, even more if we take into account that the model is more restrictive as we consider that griefers continuously press down (not only near the red nodes). Thus, we conclude that users deviating from the norm, regardless of being griefers, noise or even very smart individuals, were the ones that made finishing this part possible.
4.2.3 The politics of the crowd
As we already mentioned, on the sixth day of the game the input system was modified. This resulted in the \(start9\) riot that led to the introduction of the anarchy/democracy system. From this time on, if the fraction of users sending democracy, out of the total amount of players sending the commands anarchy or democracy, went over \(0.75\) (later modified to \(0.80\)) the game would enter into democracy mode and commands would be tallied up for 5 seconds. Then, the meter needed to go below \(0.25\) (later modified to \(0.50\)) to enter into anarchy mode again. Note that these thresholds were set by the creator of the experiment.
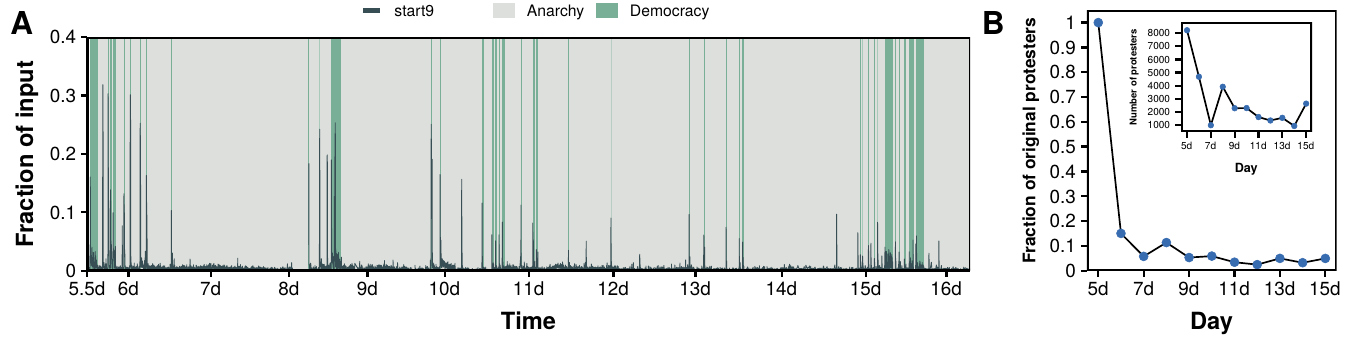
Figure 4.13: Overview of \(start9\) protests throughout the game. A) Fraction of input corresponding to the \(start9\) command. B) Fraction of users who where in the original \(start9\) riot (inset, total number of protesters each day). There were \(start9\) protests 10 days after the first one even though less than 10% of the protesters had been part of the first one.
The introduction of the voting system was mainly motivated by a puzzle where the crowd had been stuck for over 20 hours with no progress. Nonetheless, even in democracy mode, progress was complex as it was necessary to retain control of the game mode plus taking into account lag when deciding which action to take. Actually, the tug of war system was introduced at the middle of day 5, yet the puzzle was not fully completed until the beginning of day 6, over 40 hours after the crowd had originally arrived to the puzzle. One of the reasons why it took so long to finish it even after the introduction of the voting system is that it was very difficult to enter into democracy mode. Democracy was only “allowed” by the crowd when they were right in front of the puzzle and they would go into anarchy mode quickly after finishing it. Similarly, the rest of the game was mainly played under anarchy mode. Interestingly, though, we find that there were more “democrats” in the crowd (players who only voted for democracy) than “anarchists” (players who only voted for anarchy). Out of nearly 400,000 players who participated in the tug of war throughout the game, 54% were democrats, 28% anarchists and 18% voted at least once for both of them. Therefore, the introduction of this new system did not only split the crowd into two polarized groups with, as we shall see, their own norms and behaviors, but also created non trivial dynamics between them.
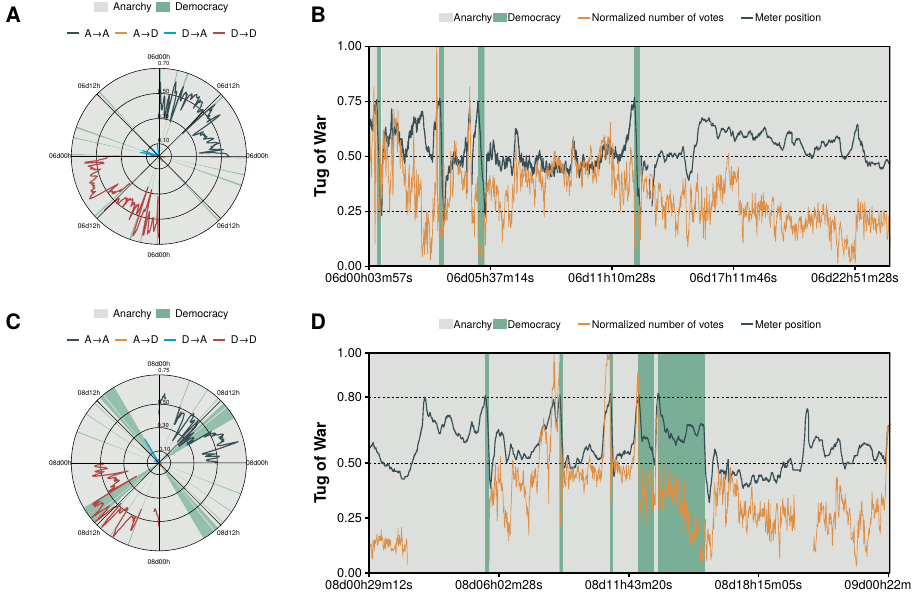
Figure 4.14: Politics of the crowd. Days 6 (top) and 8 (bottom). In every plot the gray color denotes when the game was played under anarchy rules and the green color when it was played under democracy rules. The polar plots represent the evolution of the fraction of votes corresponding to anarchy/democracy while distinguishing if the user previously voted for anarchy or democracy: first quadrant, votes for anarchy coming from users who previously voted for anarchy (\(A\rightarrow A\)); second quadrant, votes for democracy coming from anarchy (\(A\rightarrow D\)); third quadrant, votes for democracy coming from democracy (\(D\rightarrow D\)); fourth quadrant, votes for anarchy coming from democracy (\(D\rightarrow A\)). In the other plots we show the evolution of the total number of votes for anarchy or democracy as a function of time normalized by its maximum value (orange) as well as the position of the tug of war meter (blue). When the meter goes above 0.75 the system enters into democracy mode (green) until it reaches 0.25 (these thresholds were latter changed to 0.80 and 0.50 respectively) when it enters into anarchy mode (gray) again. The gap in the orange curve in panel D is due to the lack of data in that period.
The first question that arises is what might have motivated players to join into one group or the other. From a broad perspective, it has been proposed that one of the key ingredients behind video game enjoyment is the continuous perception of one’s causal effects on the environment, also known as effectance [356], thanks to their immediate response to player inputs. In contrast, a reduction of control, defined as being able to influence the dynamics according to one’s goals, does not automatically lower enjoyment [357]. This might explain why some people preferred anarchy. Under its rules, players saw that the game was continuously responding to inputs, even if they were not exactly the ones they sent. On the other hand, with democracy, control was higher at the expense of effectance, as the game would only advance once every 5 seconds. The fact that some people might have preferred anarchy while others democracy is not surprising as it is well known that different people might enjoy different aspects of a game [358]. In the classical player classification proposed by Bartle [359] for the context of MUDs (multi-user dungeon, which later evolved into what we now today as MMORPGs - massively multiplayer online role-playing games) he already distinguished four types of players: achievers, who focus on finishing the game (who in our context could be related to democrats); explorers, who focused on interacting with the world (anarchists); socializers, who focused on interacting with other players (those players who focused on making fan art and developing narratives); and killers, whose main motivation was to kill other players (griefers). Similarly, it has been seen in the context of FPSs (first person shooters) that player-death events, i.e., loosing a battle, can be pleasurable for some players (anarchists) while not for others (democrats) [360].
However, when addressing the subject of video games entertainment, it is always assumed that the player has complete control over the character, regardless of whether it is a single player game or a competitive/cooperative game. TPP differs from those cases in the fact that everyone controlled the same character. As a consequence, enjoyment is no longer related to what a player, as a single individual, has done but rather to what they, as a group, have achieved. From the social identity approach perspective this can be described as a shift from the personal identity to the group identity. This shift would increase conformity to the norms associated to each group but as the groups were unstructured their norms would be inferred from the actions taken by the rest of the group [304]. New group members would then perform the actions they saw appropriate for them as members of the group, even if they might be seen as antinormative from an outside perspective [361]. This key component of the theory is clearly constated in the behavior of the anarchists. Indeed, every time the game entered in democracy mode, anarchists started to send \(start9\) as a form of protest, hijacking the democracy. Interestingly, this kept happening even though most of the players who were in the original protest did not play anymore (see figure 4.13). Thus, newcomers adopted the identity of the group even if they had not participated in its conception. Even more, stalling the game might have been regarded as antisocial behavior from the own anarchists point of view when they were playing under anarchy rules, but when the game entered into democracy mode it suddenly turned into an acceptable behavior, something that is predicted by the theory.
To further explore the dynamics of these two groups, we next compare two different days: day 6 and day 8. Day 6 was the second day after the introduction of the anarchy/democracy dynamics and there were not any extremely difficult puzzles or similar areas where democracy might have been needed. On the other hand, day 8 was the day when the crowd arrived to the safari zone, which certainly needed democracy mode since the available number of steps in this area is limited (i.e., once the number of steps taken inside the area exceeds 500, the player is teleported to the entrance of the zone). We must note that, contrary to what we observed in section 4.2.2, in this case commands coming from low activity users are not equivalent to the ones coming from high activity users. In particular, low activity users tend to vote much more for democracy (see figure 4.15). As a consequence, although if we only take out the users with just 1 vote the position of the meter is unaffected, if we remove users with less than 10 votes the differences start to be noticeable. As such, it would not be adequate to remove low activity users in general from the analysis. Our results are summarized in figure 4.14.
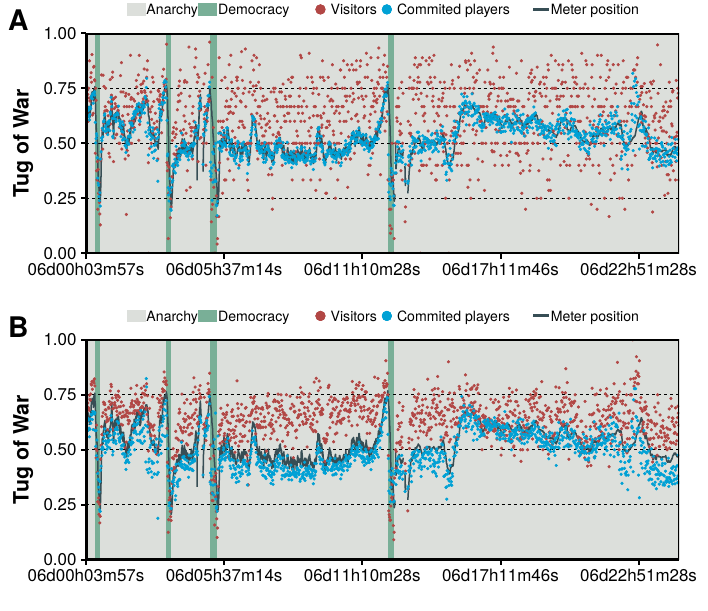
Figure 4.15: Tug of war commitment. Hypothetical meter position of the political tug of war if only votes from commited players - those who sent at least 2 votes (top) or 10 votes (bottom) throughout the whole game - are taken into account (blue) and if only votes from visitors - only one vote (top) or less than 10 (bottom) - are taken into account (red). In contrast to the ledge event, the behavior of users who sent few commands clearly differs from the ones with several commands. Visitors had a clear tendency towards democracy, while committed players preferred anarchy.
One of the most characteristic features of groups is their polarization [268], [362]. The problem in the case we are studying is that as players were leaving the game while others were constantly coming in, it is not straightforward to measure polarization. The fact that the number of votes for democracy could increase at a given moment did not mean that anarchists changed their opinion, it could be that new users were voting for democracy or simply that players who voted for anarchy stopped voting. Then, to properly measure polarization we consider 4 possible states for each user. They are defined by both the current vote of the player and the immediately previous one (note that we have removed players who only voted once, but this does not affect the measure of the position of the meter, see figure 4.15A): \(A\rightarrow A\), first anarchy then anarchy; \(A \rightarrow D\), first anarchy then democracy; \(D \rightarrow D\), first democracy then democracy; \(D \rightarrow A\), first democracy then anarchy. As we can see in figures 4.14A and 4.14C the communities are very polarized, with very few individuals changing their votes. The fraction of users changing from anarchy to democracy is always lower than 5%, which indicates that anarchists form a very closed group. Similarly, the fraction of users changing from democracy to anarchy is also very low, although there are clear bursts when the crowd exits democracy mode. This reflects that those who changed their vote from anarchy to democracy do so to achieve a particular goal, such as going through a mace, and once they achieve the target they instantly lose interest in democracy.
With such degree of polarization the next question is how was it possible for the crowd to change from one mode to the other. To do so, we shift our attention to the number of votes. In figure 4.14B we can see that every time the meter gets above the democracy threshold it is preceded by an increase in the total number of votes. Then, once under democracy mode, the total number of votes decays very fast. Finally, there is another increment before entering again into anarchy mode. Thus, it seems that every time democrats were able to enter into their mode they stopped voting and started playing. This let anarchists regain control even though they were less users, leading to a sharp decay of the tug of war meter. Once they exited democracy mode, democrats started to vote again to try to set the game back into democracy mode. In figure 4.14D we can see initially a similar behavior in the short periods when democracy was installed. However, there is a wider area were the crowd accepted the democracy, this marks the safari zone mentioned previously. Interestingly, we can see how democrats learned how to keep their mode active. Initially there was the same drop on users voting and on the position of the meter seen in the other attempts. This forced democrats to keep voting instead of playing, which allowed them to retain control for longer. Few minutes later the number of votes decays again but in this case the position of the meter is barely modified probably due to anarchists finally accepting that they needed democracy mode to finish this part. Even though they might have implicitly accepted democracy, it is worth noting that the transitions \(A \rightarrow D\) are minimum (figure 4.14C). Finally once the mission for which the democracy mode was needed finished, there is a sharp increment in the fraction of transitions \(D \rightarrow A\).
4.2.4 The challenges of digital crowds
In this section we have analyzed a crowd based event where nearly 1 million users played a game with the exact same character. Remarkably, the event was not only highly successful in terms of participants but also in length, lasting for over two weeks. As we discussed in the introduction of section 4.2, motivating a crowd to complete a project is not an easy task. Yet, this event is an example that this can happen even in the absence of any material reward, signaling once again that online crowds have their own rules which might depart from what has been studied in the offline world.
Although the overall success of the event is probably due to a mixture of many factors, there is one that we can extract from the chat logs which is quite interesting. The game was disordered, progress was slower than if played individually, and often really bad actions were taken (such as mistakenly releasing some of the strongest Pokémons) which might have led to frustration. Indeed, by looking at the stretchable words sent by the users [363} it is possible to measure the frustration the players felt during the event, figure 4.16. Although usually frustration has a negative connotation, in the context of games it has been observed that frustration and stress can be pleasurable as they motivate players to overcome new challenges [364]. Actually, there is a whole game genre known as “masocore” (a portmanteau of masochism and hardcore) which consists of games with extremely challenging gameplay built with the only purpose of generating frustration on the players [365]. Similarly, there are games which might be simpler but that have really difficult controls and strange physics, such as QWOP, Surgeon Simulator or Octodad, which are also built with the sole aim of generating frustration [366]. Thus, the mistakes performed by the crowd might have not been something dissatisfactory but completely the opposite, they might have been the reason why this event was so successful.
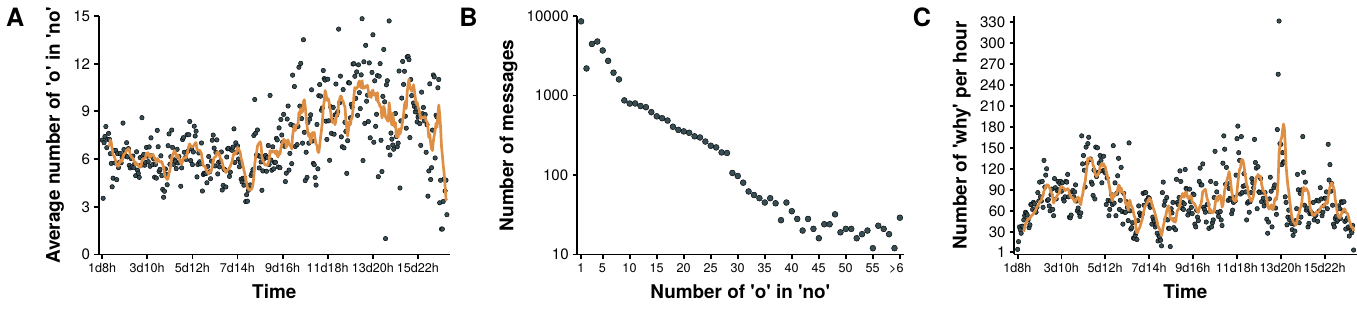
Figure 4.16: Measures of frustration. A) Players expressed their frustration by adding more times the letter o when they wanted to say no. Even though frustration was present throughout the event, it was incremented after the events of what is known as Bloody Sunday. B) Distribution of the number of o. Interestingly, the relationship is not linear as the word noo tends to appear less than nooo or noooo, which indicates that when players were frustrated they overexpressed it. C) Number of messages containing the word why per hour. This indicates that many players did not understand the actions of the crowd, which probably made them feel frustrated.
One of the particularly frustrating areas was the ledge, a part of the game that can be completed in a few minutes but that took over 15 hours to complete. We have seen that in this area the behavior of low and high activity users is quite similar, even though they might have been unaware of it. Besides, we have built a model to explain how the crowd was able to finally exit this part and shown how a minority - either in the form of griefers, smart users or simply na"ive individuals - can lead the crowd to a successful outcome, even in the lack of consensus. Note also that the fact that they only needed roughly 1/3 of the time to traverse the area on their second attempt compared to their first one might be a signal of the crowd learning how to break the herding effect. Unfortunately, with just two observations we cannot test this hypothesis. It would be interesting, though, to design experiments inspired by this event with the purpose of measuring if the crowd is able to learn and, if it does so, how long does it take, what would happen if a fraction of the crowd is substituted by new players, etc.
To conclude this section, we have also analyzed the effects that the introduction of a voting system had in the crowd. We have seen how the crowd was split into two groups and we have been able to explain the behavior of these groups using the social identity approach. We saw how norms could last within groups longer than their own members, as predicted by the theory. Note that this theory was introduced during the 1980s, way before Internet was as widespread as it is today, and still it can be applied, at least in this case, to online groups. Hence, despite the many differences that exist between the online and offline worlds, maybe they are not that far apart after all.
We have emphasized the crucial change in the definition. Rumor was no longer just something, it was something that spread from person to person. The obvious similarities of this definition with disease dynamics led Daley and Kendall to propose in 1964 that the spread of a rumor in a closed community should resemble the spread of an epidemic. Furthermore, they adapted the SIR model presented in chapter 3 to this context using ignorants, spreaders and stiflers [261].↩︎
To put this date into perspective, Facebook was created in 2004, although its Spanish version was not released until 2008 [277]. Similarly, Twitter was created in 2006 and its Spanish version was released in late 2009 [278].↩︎
The chat logs can have either seconds (YYYY-MM-DD HH:MM:SS) or minute (YYYY-MM-DD HH:MM) resolution. The game started on February 12, 2014 at 23:16:01 UTC, but the first log recorded corresponds to February 14, 2014 at 08:16:19 GMT+1. Besides, the log data between February 21, 2014 at 04:25:54 GMT+1 and 07:59:22 GMT+1 is missing. We extracted the position of the tug of war meter that will be described in section 4.2.3 as well as the game mode active at each time from the videos using optical character recognition techniques.↩︎